Indian Investors, like their global counterparts, are swayed by elections. They show their enthusiasm, or lack of it, both before and after national polls. Leaders too matter. People buy and sell stocks based on who is likely to become the Prime Minister, and who finally does
By Alam Srinivas
- Uncertainty links politics and stocks, as voters and investors remain unsure about poll outcomes, evident in recent pre-poll and exit poll inaccuracies
- In the US and Europe, analysts examine Sensex movements for political stock effects. India’s market matured in the 1990s
- To curb unfair advantages, the ECI enforces a policy freeze, barring major government announcements months before elections to sway voters
- Bill Clinton, a Democrat President, earned a reputation for a strong economy with a record-high cumulative stock return of almost 210%.
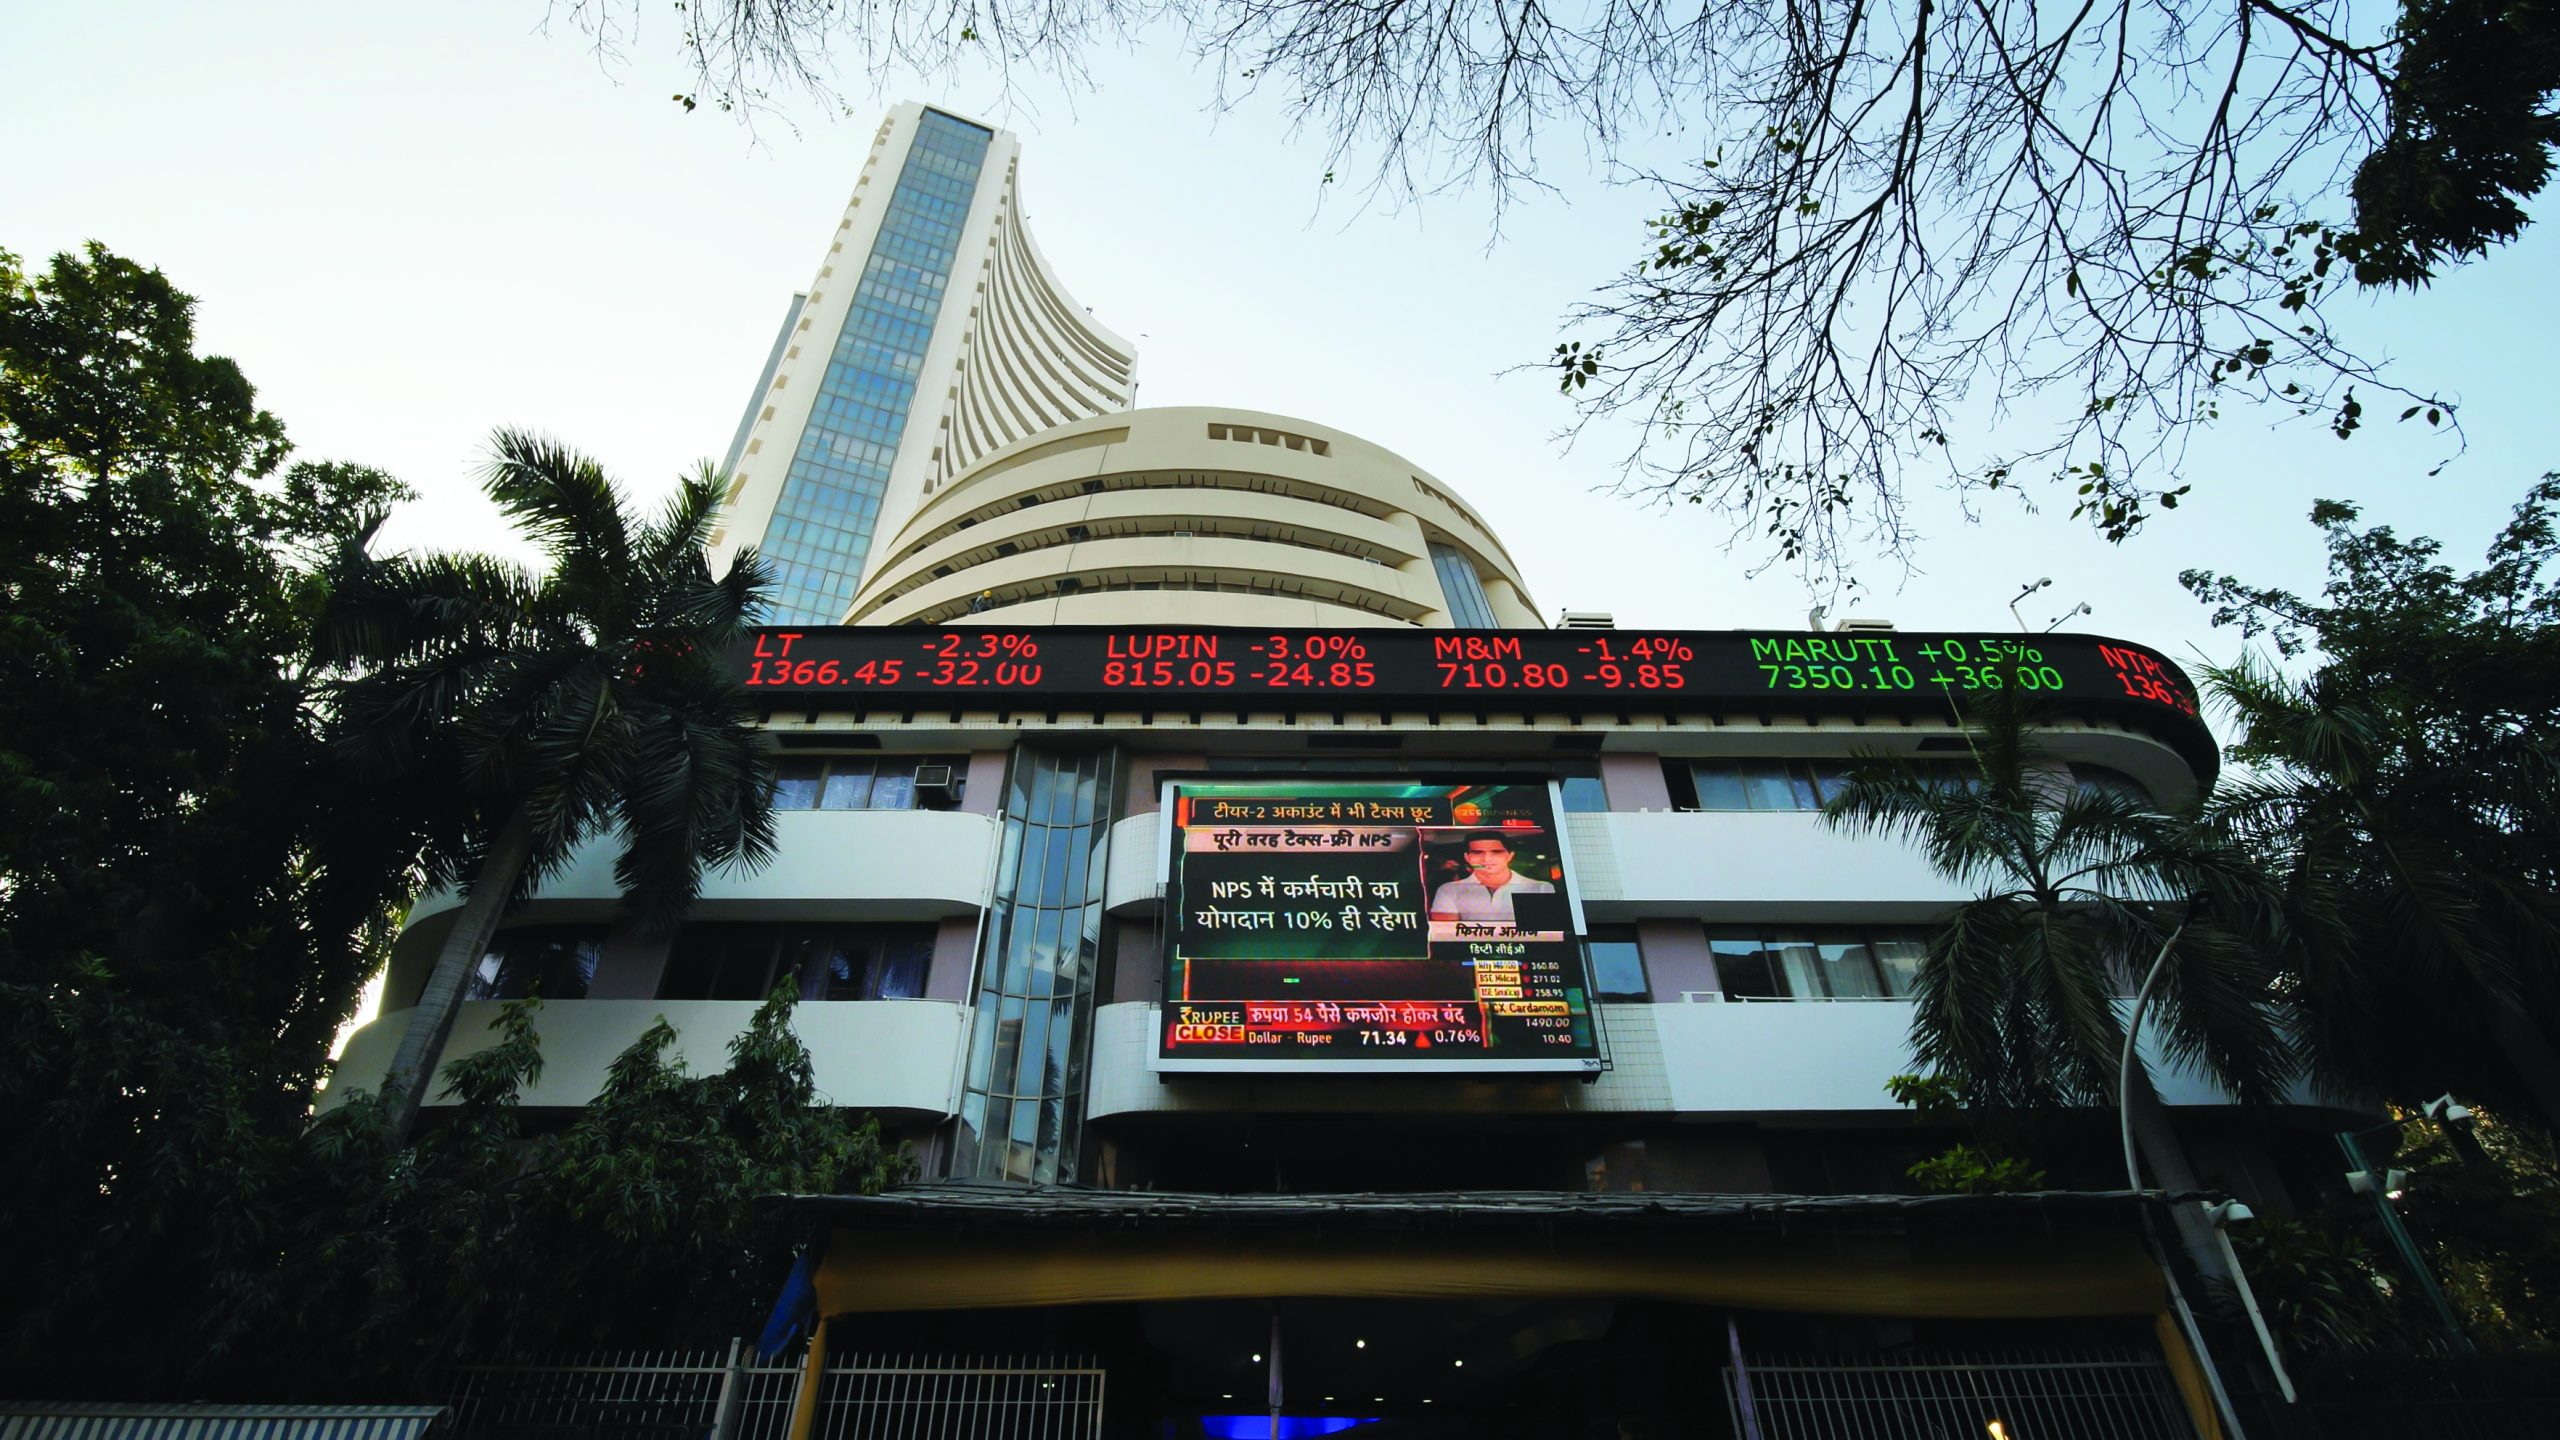
THE day after the assembly election results in three states in the Hindi heartland in December 2023, the BSE Sensex, the stock index of Bombay Stock Exchange, surged by over 2%, or nearly 1,400 points. Voters defied pre-poll predictions, and overwhelmingly voted the BJP to power in the states of Rajasthan, Madhya Pradesh, and Chhattisgarh. Investors were thus enthused about political stability. They felt that with this resurgence, the BJP was likely to win a majority for the third time in the 2024 national elections. Narendra Modi would become the Prime Minister – yet again.
After the grand performances in the three elections, there were the obvious political and economic grandstanding. Initially, Modi boldly and confidently announced that his party would achieve a national electoral ‘hattrick’, after the state-level ‘hattrick’. A few weeks later, he boasted that India would emerge as the third-largest economy during his third reign. Despite the volatility, stocks boomed, and the Sensex crossed 70,000 in December 2023. It marked a mouth-watering, phenomenal, and unbelievable rise of nearly three times within 115 months, or since Modi came to power in May 2014.
Prior to national elections, in India and other nations, stock markets tend to prepare themselves for future electoral outcomes. Based on predictions and expectations, stock prices surge or dip. The ideologies and manifestos of political parties that might come to power drive the stocks, either up or down. In India, in a bid to prevent the ruling regime from gaining unfair poll advantages, the Election Commission mandates a policy-freeze period. A few months before the elections, the government cannot not announce major policies or welfare schemes that can sway voters. This is the reason why an interim Budget was presented, aimed to get revenues and expenditures in order, and the final Budget will be presented when a new government assumes power after the national election results.
Politics matters to investors, as much as politicians invariably keep an eye, albeit obliquely, on the Sensex. Obviously, stockholders believe in facts and figures, science and math of economics, profits earned by specific companies, and policies pursued by regimes-in-power. But they are also driven by feelings, emotions, and sentiments. They are inflicted by fears (FOMO, fear of missing out, and FOLO, fear of losing out), greed, and desires. Any uncertainties, related to politics, economics, or business, and every event that dents or uplifts their future expectations can goad to buy or sell shares.
Rational excitement mixes with irrational mania, as shareholders traverse the ups and downs, highs and lows, eagerness and apathy, passions and indifferences, and bouts of buying and selling during their tumultuous and roller-coaster investment journey. Hence, electoral exuberances, and predictions of possible policy permutations of the new regimes, are also responsible for the wave-like rise and fall of the Sensex. Since national elections will be held this year, with polls in a few months, it is an opportune time to track, trace, trip, and trade on the virtues and vices of how electoral politics impact stocks.
WHOSE WAVE IS IT, ANYWAY?
In the US, and European nations, it is fashionable to pour over data related to the past several decades, even the last 100 years, to study the ‘stock’ effects of politics. In India, experts tend to look at Sensex gyrations over the past two decades. This is for several reasons. Indian stock markets became deep and mature during the 1990s, when reforms kicked in, which wooed domestic retail investors, people like you and I, and foreign institutions with billions of dollars in their pockets. Hence, the movements of the index realistically reflected the factual ground realities and wild emotions of traders.
In 2004, when Manmohan Singh arrived, the Sensex fell by 400 points during the 180 days. In 2009, when he returned, it was up by an astounding 6,000 points. In Modi’s case, the respective figures in 2014 and 2019 were an increase of over 4,000 points and a fall of over 1,300 points
Obviously, both in the short-term, i.e., months before and months after national elections, and longer term, a year or two after the polls, the political party that is expected to come to power, and does it too, matters. Since 1991, except in 2014 and 2019, Indian regimes were defined by coalitions, sometimes strong, sometimes fragile. Investors clearly factored this in their calculations before the polls. The trick was to figure out if the potential coalition was likely to be stable or not. Whether the main political party, the Congress or BJP, would be able to keep its flock of dozens of regional parties together.
Recent reports suggest that there were no surprises when the bulls, or buyers, revved up the Sensex during the 12 months before the October 1999 and May 2004 election results. In 1999, the BJP-led NDA coalition, having tasted power for 13 months, was expected to come back with force.
In 2004, the hope was that the NDA would win for the third time. When there were contrary hints, stocks dived, and the Sensex dipped by 7.5% during the month before the results. Shocked and shaken by the Congress-led UPA’s victory, the bears, or sellers, capsized the index by over 14% in the 30 days after the results.
Given the unexpected stability and reforms-driven policies of the two regimes, NDA (1999-2004) and UPA-1 (2004-09), the Sensex zoomed in the two years after the election results – nearly 38% in the first case, and a bamboozling 121.5% in the second one. In the year prior to the 2009 poll results, the future of the UPA regime seemed rocky. During the period, the Sensex crashed by 25%, but recovered admirably in the 30 days prior to the results as news filtered in that the UPA might scrape through. The index moved 7% in the two years after the results due to backbiting among coalition partners and scandals.
People were sure that the UPA would stumble and tumble in 2014, and the chances of Modi’s grand entry on to the political stage grew exponentially. The Sensex heaved a sigh of relief, and went up by nearly 17% in the 12 months before the election results. In the 30 days prior to it, the rise was 8%. The returns in the 12 months and 24 months after the results were good. In 2019, the investors were bored and subdued. Modi was unstoppable. The only curiosity was whether the BJP would win more seats than its 2014 tally. The index lumbered just over 5% during the 12 months prior to the election results.
DO NOT BE TOO OVERCONFIDENT
As one can see from the above analysis, there are no set patterns. Since emotions and feelings fluctuate wildly, sometimes from moment to moment, so do expectations and desires. Hence, if you wish to find historical truths that may be applicable in the future, do it at your own peril. For example, if you extrapolate that stocks do well when the BJP or its coalitions are in power, or expected to be, think again. During the 30 days prior to the 2019 poll results, the Sensex was down a tad, by 0.4%. In the 12 months after, it was down by 2.8%. The returns over 24 months after the results were a meager 2.4%.
The story, as if by default and with deliberate precision, repeats in other countries too. The random behavior, without any regular trends or predictable movements, seems to be the certainty. Past research in the US proved that the stock market returns were “much higher under Democratic presidents than under Republican presidents.” Between 1925 and 2015, the “average excess market return under Democratic presidents is 10.7% a year, whereas under Republican presidents it is only -0.21%.” According to a recent paper, this difference of 11% a year is “highly significant both economically and statistically.”

In Canada and France, the returns were higher when Left-oriented political parties were in power. In Australia, Germany, and the UK, the same was true when Right-focused parties were in power. In both cases, states a recent study, the differences in returns are “not statistically significant”
Experts built a hypothesis and formula to explain this trend. US voters elect a Democrat when there is an economic crisis, and a Republican when the going is good. In economic jargon, the risk aversion is higher under a Democrat and, hence, so is the equity risk premium. This results in higher returns. The opposite is true for Republican governments. In simple terms, when you do not wish to take risks with your money, individuals, institutions, even markets, need to offer higher rewards to attract your wealth. You will invest in a chit fund only if the interest is way higher than fixed deposits.
However, latest research points out fallacies in the logic. Most of the difference in returns, under Democrats and Republicans, can be understood if one looks at the state of the economy when the presidents assumed power. “Specifically, a Republican was president during the two great financial and economic crashes that began in 1929 and in 2008, respectively; unsurprisingly, a Democrat held the office of president during the immense subsequent recoveries. This appears to explain the majority of the return difference,” states a recent report, which debunks the Democrat-Republican theory.
When the same calculations were done for other developed nations in Europe, North America, and Asia, the conclusions differed. In Canada and France, the returns were higher when Left-oriented political parties were in power. In Australia, Germany, and the UK, the same was true when Right-focused parties were in power. In both cases, states a recent study, the differences in returns are “not statistically significant.” As the authors explain, “We see no evidence that these results can be anything but random chance and find it hard to imagine the situation in the United States is so very different that the 10.9% gap is anything other than a statistical outlier.”
SURELY, LEADERS MATTER A LOT
Even if political parties do not matter too much, surely, leaders do. The stock market would be expected to be in a positive frenzy if a Modi, who catapulted to power because of his much-touted Gujarat Model of Development, and proven economic track record, or a Manmohan Singh, with his miraculous policies in the first half of 1990s, became the Prime Minister. The opposite could happen if a seemingly-weak Prime Minister, say Dewe Gowda (with due respect to him), was at the helm. Past experiences show that this is only partially true. The mix between rational realities and irrational exuberance can be explosive and shocking, to say the least.
As per media reports, during a six-month period, three months before election results and three months after, the stock market was full of surprises. In 2004, when Manmohan Singh arrived, the Sensex fell by 400 points during the 180 days. In 2009, when he returned, it was up by an astounding 6,000 points. In Modi’s case, the respective figures in 2014 and 2019 were an increase of over 4,000 points, and a fall of over 1,300 points. The Sensex skyrocketed during Dewe Gowda’s time, as P. Chidambaram, who considers himself the country’s best finance minister, presented a ‘dream’ budget. Go figure!
The same is true about the US leaders. Among Democrat presidents, Bill Clinton was considered good for the economy, and the cumulative stock returns during his tenure was almost 210%. This is the highest among any president, Democrat or Republican. Clinton inherited a good economy, rode the Internet wave on technology seas, and stabilized the economy through high taxes that allowed for high interest rates, which controlled inflation. “Since the economy was doing well… he was able to keep the momentum which resulted in positive returns in the stock market,” states a research report.
Barack Obama, another Democrat, was considered on the left side of the economic spectrum. He made several remarks that negatively impacted stocks. Yet, during his tenure, America’s S&P stock index showed a positive return of more than 180%. He was in power during the 2008 Financial Crisis, when the world faced its worst recession since 1929, and was hobbling back to recovery. Thus, stocks, which reached their nadir, bounced back. There were non-political events, like the huge earnings by technology firms such as Apple, Microsoft, and Amazon, which energized the US stock index.
Lest you come to the logical conclusion, which we mentioned earlier, that Democrats are better for stocks than Republicans, let us bust this myth again. During the tenures of two Republican presidents, Ronald Reagan and Dwight Eisenhower, the S&P showed attractive returns of 117% and 129%, respectively. This is despite the crippling fact that Eisenhower grappled with three recessions (1953, 1958, and 1960) during his two terms. Reaganomics, which reflected Reagan’s policies, was based on tax cuts, which helped companies and their stocks, and lower government spending, which kept prices low.
WHAT DOES THIS MEAN FOR YOU
Uncertainty is the key issue when it comes to gauge the links between electoral politics and the stock market. Both voters and investors are normally unsure about poll results, which is proved by how pre-poll surveys, and exit polls, have gone horribly wrong in the recent past. No one, for instance, predicted the unprecedented victory for the BJP in the Madhya Pradesh assembly elections. Or that the NDA was likely to lose in 2004 despite the ‘Shining India’ campaign. It is this chaos that leads to high volatility in stock prices and stock indices. More certainty, as in 2019, when Modi came back to power, lowers it.
A recent research paper posited two hypotheses to explain the election-stock relationship. During the pre-election phase, poll results-related uncertainties impact stock returns. Investors tend to hedge their bets if they are not sure about electoral outcomes. “For example, prior to the 2020 US presidential election, the trading volume of call and put options (or betting on future stock prices and stock index movements) with maturities covering election period and aftermath has significantly increased in response to the higher implied volatility prior to the election,” states a 2020 study.
Politics matter to investors, as much as politicians invariably keep an eye, albeit obliquely, on the Sensex. Obviously, stockholders believe in facts and figures, the science and math of economics, profits earned by specific companies, and policies pursued by regimes in power. But they are also driven by feelings, emotions, and sentiments
Election uncertainty links up with information uncertainty. The less information that investors have about elections, the more they are worried, and gripped with fear, which increases stock volatility. Higher trading may result in better stock returns. But then one needs to account for political uncertainty, or policy uncertainty. In some cases, while investors are sure of which political party may win, they are not clear about the policies it may pursue. Contrary to logical expectations, a decrease in election uncertainty may enhance political uncertainty, which may lead to higher volatility and higher returns.
The second hypothesis relates to the post-election scenario. This is dubbed as election jolts, when the “electoral outcome does not correspond to voters’ expectation,” and would, therefore, “constitute as election shock.” It is logical to assume that when a political party wins a higher or equal number of seats, as was expected before the results, the shock effect is minimal, and stock returns are lower. The opposite too is true. This may explain the huge rise in the Sensex the day after the recent state assembly polls, as the Congress won less seats than it was expected to do, and the BJP did unexpectedly well.
What about the fall in the Sensex in the weeks after the results of the 2004 national elections were announced, and the NDA surprisingly lost, and did worse than it was expected to do. Volatility was high, but returns were dismal. So, take nothing for granted. The uncertainty factors behave in uncertain and random ways. What works in one instance may not do so in another case. At the end of the day, any model needs to incorporate investor irrationality which, of course, is impossible to predict, whether before, during, or after elections.
